Added plugin to monitor Unbound - Just wanted to see what it would give me - Probably wont use it
Added additional config for Unbound - Just wanted to see what it would give me - Probably wont use it
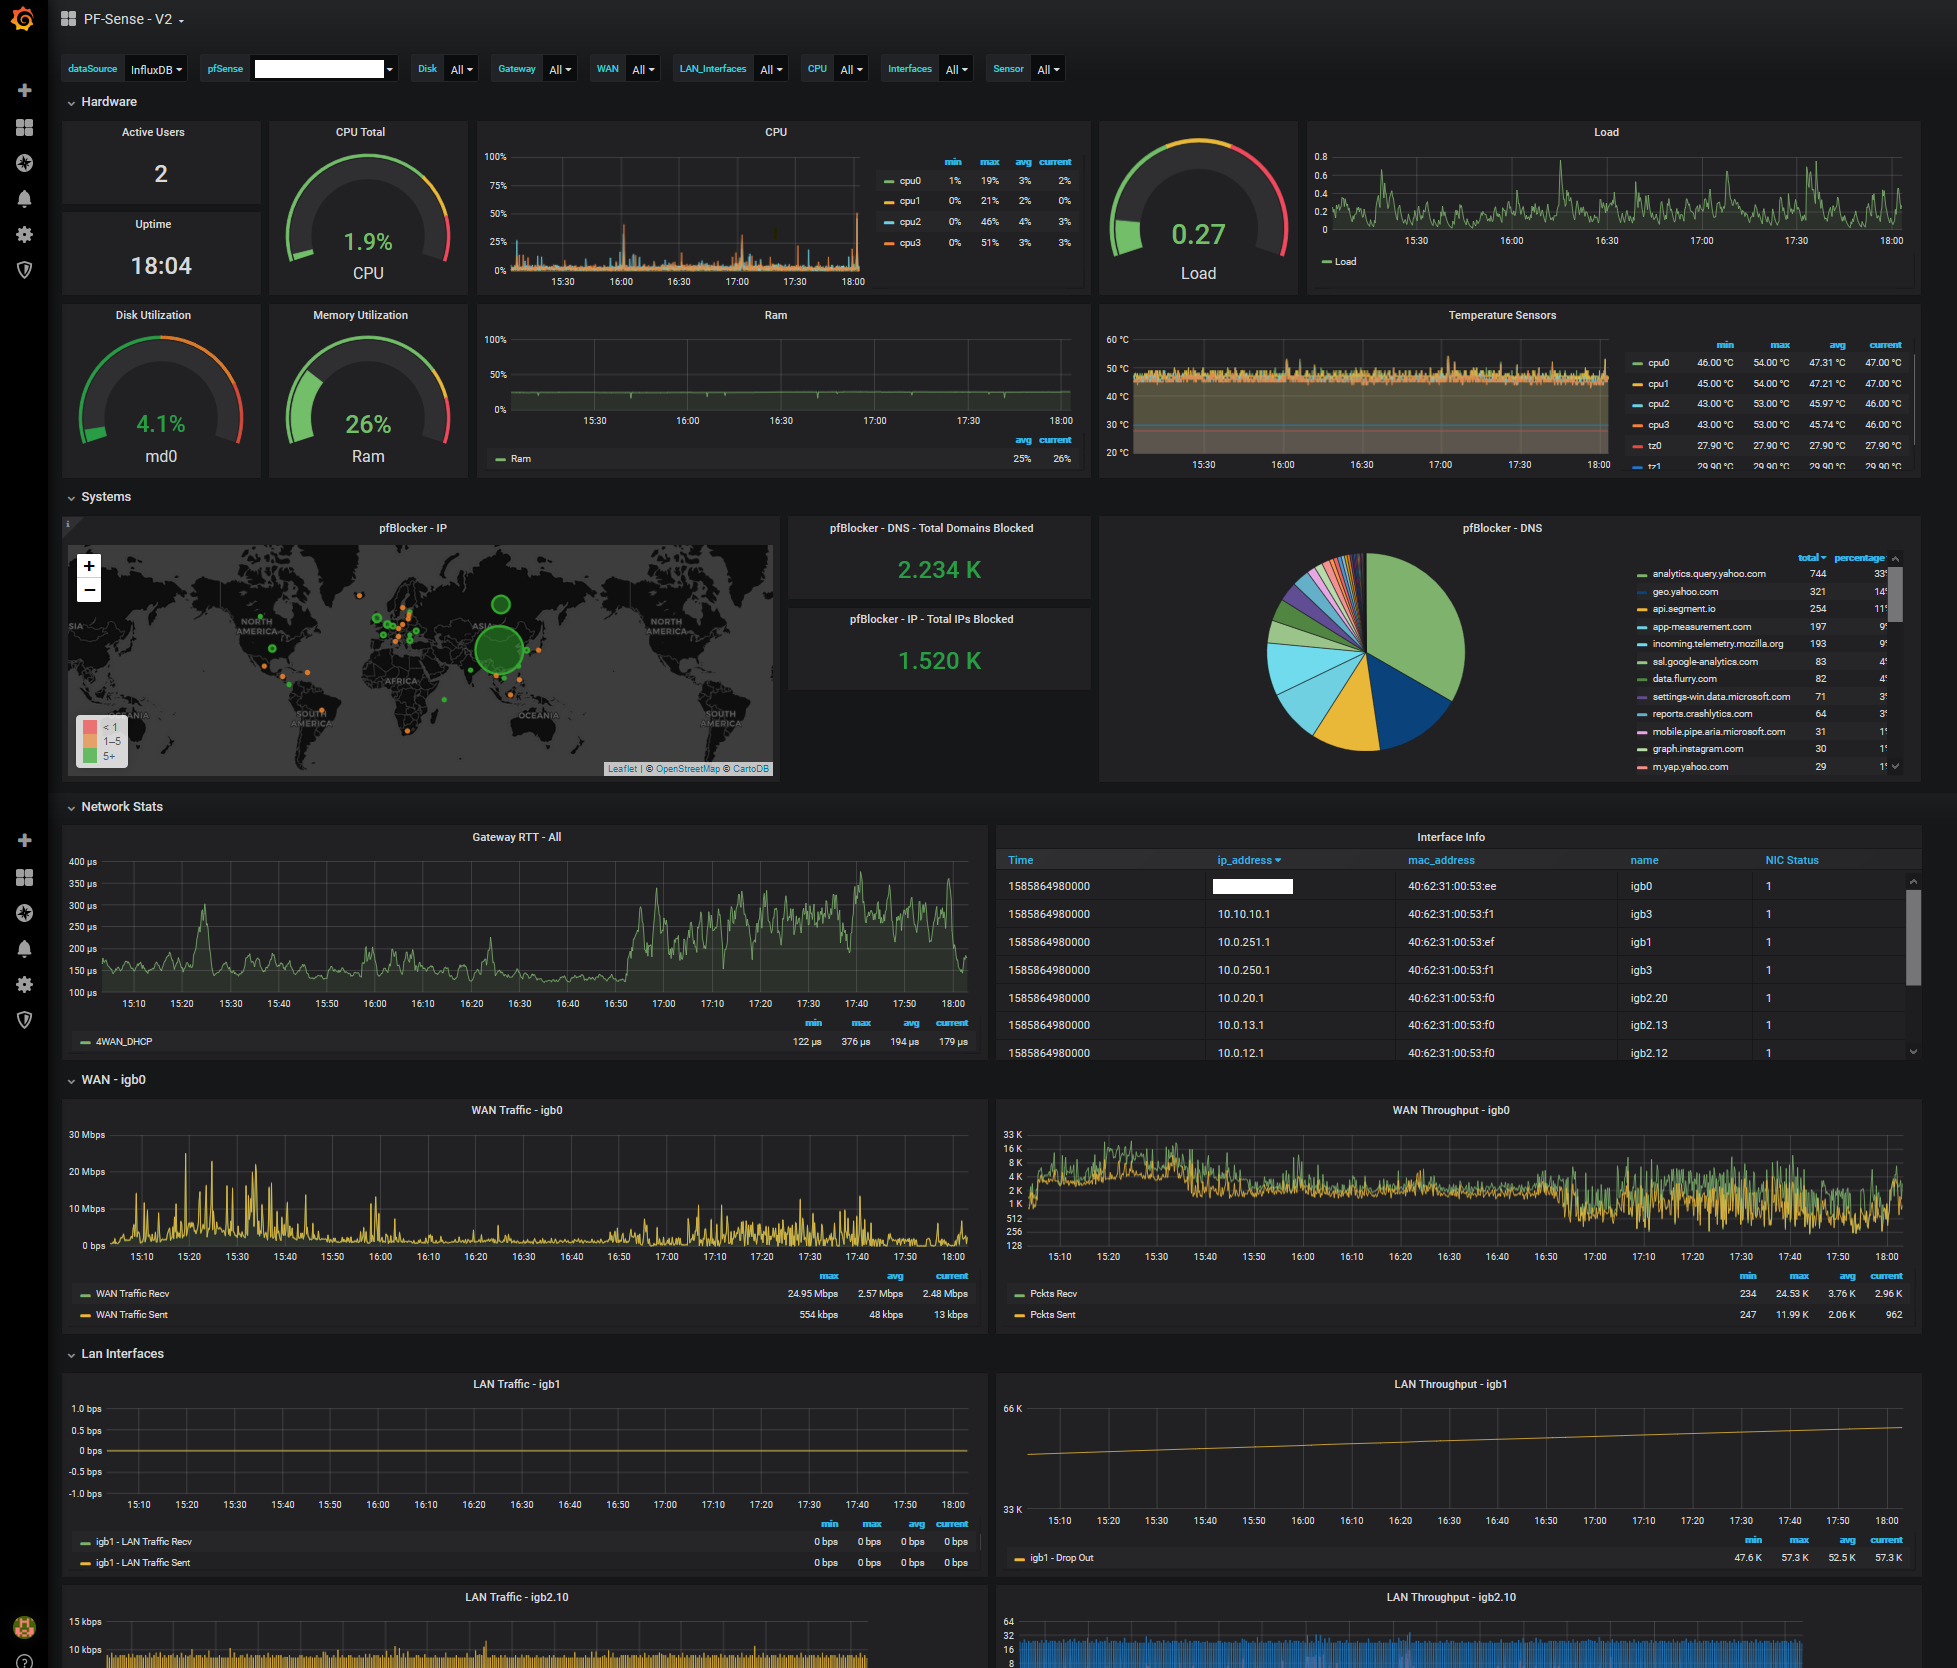
What's Monitored
- Active Users
- Uptime
- CPU Load total
- Disk Utilization
- Memory Utilization
- CPU Utilization per core (Single Graph)
- Ram Utilization time graph
- Load Average
- Load Average Graph
- CPU and ACPI Temperature Sensors
- pfBlocker IP Stats
- pfBlocker DNS Stats
- Gateway Response time - dpinger
- List of interfaces with IP, MAC and Status
- WAN Statistics - Traffic & Throughput (Identified by dashboard variable)
- LAN Statistics - Traffic & Throughput (Identified by dashboard variable)
Configuration
The Config for the dashboard relies on the variables defined within Grafana. When importing the dashboard, make sure to select your datasource.
Dashboard Settings -> Variables
WAN - $WAN is a static variable defined so that a separate dashboard panel can be created for WAN interfaces. Use a comma-separated list for multiple WAN interfaces.
LAN_Interfaces - $LAN_Interfaces uses a regex to remove any interfaces you don't want to be grouped as LAN. I have my WAN adapter and igb2 that hosts multiple vlans and nothing else. The filtering happens in the "Regex" field. I use a negative lookahead regex to match the interfaces I want to be excluded. It should be pretty easy to understand what you need to do here. After writing this up, I realize I need to change this variable name, it's just not going to happen right now.
Running on
Grafana 6.7.1
Influxdb 1.7.10
I was going to post this in the thread made by /u/seb6596 since this is based on their dashboard, but I made quite a few changes and wanted to include information that would get lost in the thread.
What I updated:
- Created dashboard wide variables to make the dashboard more portable and easily configurable. You shouldn't need to update any of the queries.
- Took some inspiration and panels from this dashboard
- Included gateway RTT from dpinger thanks to this integration
- Used telegraf configs from this post by /u/PeskyWarrior
- Tag, templating - No need to specify all cpus or interfaces in the graph queries. These values are pulled in with queries.
- Added chart to show all adapters, IP, MAC and Status from here
- Added Temperature data based on feedback from /u/tko1982 - CPU Temp and any other ACPI device that reports temp is now collected and reported
- Cleaned up the telegraf config
The dashboard has a bunch of variables that you don't need to mess with. The only one you will want to change is the $WAN. Just set that to your WAN interface and the graphs will update accordingly. There is a row for WAN network statistics that keys off of the $WAN variable. The LAN statistics include data for all interfaces excluding $WAN. You could easily apply this to any other interface you want to highlight.
What I didn't do and need help with:
- Include IP and ping methods from /u/seb6596 when they are back online.
- Make it pretty. I've never been good at this part
- Get the RTT calculations right from the dpinger integration. It's in microseconds but for some reason doesn't match the graphs in pfSense when I compare them.
Plugins
I put all my plugins in /usr/local/bin and set them to 555
To troubleshoot plugins, add the following lines to the agent block in /usr/local/etc/telegraf.conf
debug = true
quiet = false
logfile = "/var/log/telegraf/telegraf.log"
In pfSense, under Services -> Teltegraf, at the bottom of the page with the teeny tiny text box, I have the following additional configuration included the extra config listed in the config dir
