---
title: Collect data using Network Monitor
description: Learn how to run Network Monitor to collect data for troubleshooting TCP/IP connectivity.
ms.prod: w10
ms.sitesec: library
ms.topic: troubleshooting
author: dansimp
ms.localizationpriority: medium
ms.author: dansimp
ms.date: 01/27/2022
ms.reviewer:
manager: dansimp
ms.collection: highpri
---
# Collect data using Network Monitor
In this article, you'll learn how to use Microsoft Network Monitor 3.4, which is a tool for capturing network traffic.
> [!NOTE]
> Network Monitor is the archived protocol analyzer and is no longer under development. Also, Microsoft Message Analyzer (MMA) was retired and its download packages were removed from microsoft.com sites on November 25, 2019. There is currently no Microsoft replacement for Microsoft Message Analyzer in development at this time. For similar functionality, consider using another, non-Microsoft network protocol analyzer tool. For more information, see [Microsoft Message Analyzer Operating Guide](/message-analyzer/microsoft-message-analyzer-operating-guide).
To get started, [download Network Monitor tool](https://www.microsoft.com/download/details.aspx?id=4865). When you install Network Monitor, it installs its driver and hooks it to all the network adapters installed on the device. You can see the same on the adapter properties, as shown in the following image:
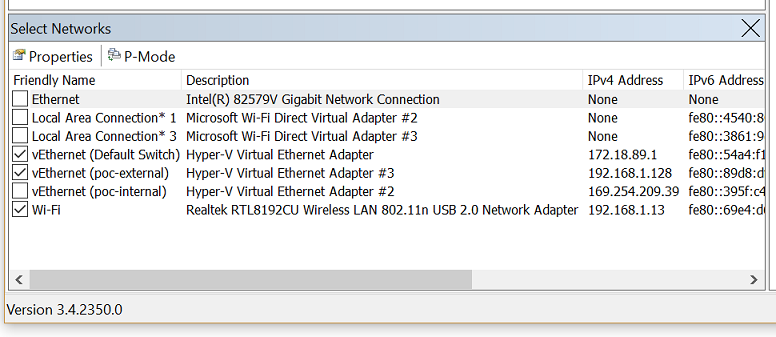
When the driver gets hooked to the network interface card (NIC) during installation, the NIC is reinitialized, which might cause a brief network glitch.
**To capture traffic**
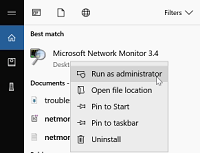
1. Run netmon in an elevated status by choosing **Run as Administrator**.
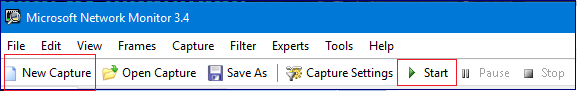
2. Network Monitor opens with all network adapters displayed. Select the network adapters where you want to capture traffic, click **New Capture**, and then select **Start**.
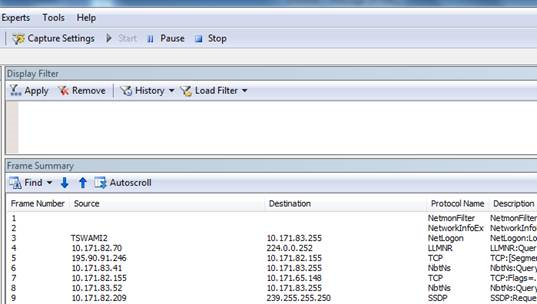
3. Reproduce the issue, and you'll see that Network Monitor grabs the packets on the wire.
4. Select **Stop**, and go to **File > Save as** to save the results. By default, the file will be saved as a ".cap" file.
The saved file has captured all the traffic that is flowing to and from the selected network adapters on the local computer. However, your interest is only to look into the traffic/packets that are related to the specific connectivity problem you're facing. So you'll need to filter the network capture to see only the related traffic.
**Commonly used filters**
- Ipv4.address=="client ip" and ipv4.address=="server ip"
- Tcp.port==
- Udp.port==
- Icmp
- Arp
- Property.tcpretranmits
- Property.tcprequestfastretransmits
- Tcp.flags.syn==1
>[!TIP]
>If you want to filter the capture for a specific field and do not know the syntax for that filter, just right-click that field and select **Add *the selected value* to Display Filter**.
Network traces that are collected using the **netsh** commands built in to Windows are of the extension "ETL". However, these ETL files can be opened using Network Monitor for further analysis.
## More information
[Intro to Filtering with Network Monitor 3.0](/archive/blogs/netmon/intro-to-filtering-with-network-monitor-3-0)
[Network Monitor Filter Examples](https://blogs.technet.microsoft.com/rmilne/2016/08/11/network-monitor-filter-examples/)
[Network Monitor Wireless Filtering](https://social.technet.microsoft.com/wiki/contents/articles/1900.network-monitor-wireless-filtering.aspx)
[Network Monitor TCP Filtering](https://social.technet.microsoft.com/wiki/contents/articles/1134.network-monitor-tcp-filtering.aspx)
[Network Monitor Conversation Filtering](https://social.technet.microsoft.com/wiki/contents/articles/1829.network-monitor-conversation-filtering.aspx)
[How to setup and collect network capture using Network Monitor tool](/archive/blogs/msindiasupp/how-to-setup-and-collect-network-capture-using-network-monitor-tool)