1.8 KiB
In this topic, we'll first take a look at how you can import an Excel workbook file containing a simple table from a local drive into Power BI. You'll then learn how you can begin exploring that table's data in Power BI by creating a report.
Make sure your data is formatted as a table
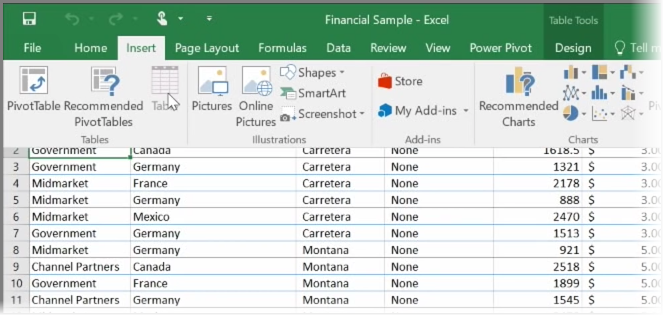
In order for Power BI to import data from your workbook, that data needs to be formatted as a table. It's easy. In Excel, you can highlight a range of cells, then on the Insert tab of the Excel ribbon, click Table.
You'll want to make sure each column has a good name. It will make it easier to find the data you want when creating your reports in Power BI.
Import from a local drive
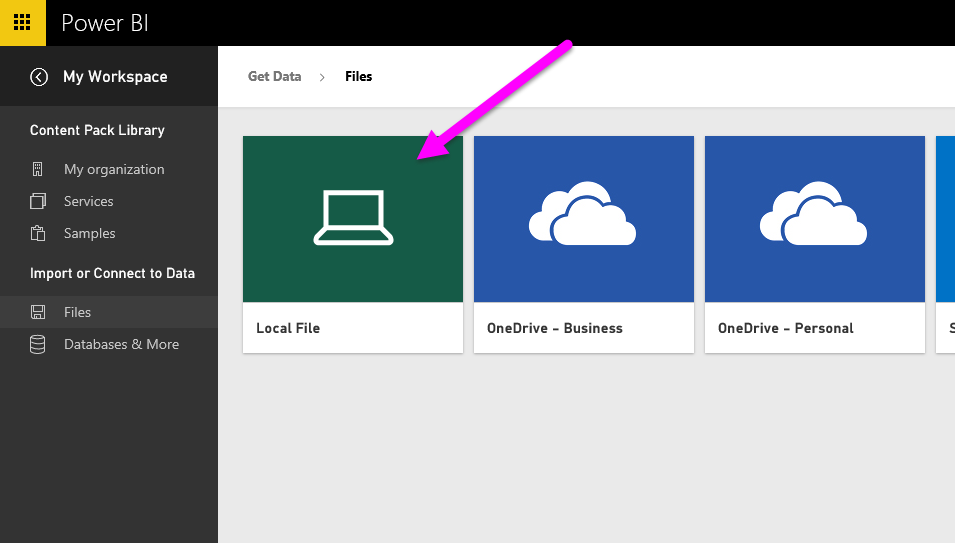
Wherever you keep your files, Power BI makes it easy to import them. In Power BI, you can use Get Data > Files > Local File, to find and select the Excel file we want.
Once imported into Power BI, you can begin creating reports.
Your files don't have to be on a local drive, of course. If you save your files on OneDrive or SharePoint Team Site, that's even better. We'll go into more details about that in a later topic.
Start creating reports
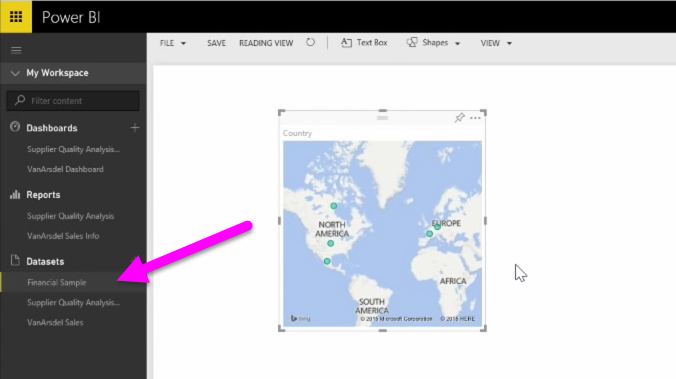
Once your workbook's data has been imported, a dataset is created in Power BI. It appears under Datasets. Now you can begin exploring your data by creating reports and dashboards. Just click on the Open menu icon next to the dataset and then click Explore. A new blank report canvas appears. Over on the right, under Fields, you'll see your tables and columns. Just select the fields you want to create a new visualization on the canvas.
You can change the type of visualization and apply filters and other properties under Visualizations.


