2.5 KiB
title, description, ms.prod, ms.sitesec, ms.topic, author, ms.localizationpriority, ms.author, ms.date
| title | description | ms.prod | ms.sitesec | ms.topic | author | ms.localizationpriority | ms.author | ms.date |
|---|---|---|---|---|---|---|---|---|
| Collect data using Network Monitor | Learn how to run Network Monitor to collect data for troubleshooting TCP/IP connectivity. | w10 | library | troubleshooting | kaushika-msft | medium | kaushika | 12/06/2018 |
Collect data using Network Monitor
In this topic, you will learn how to use Microsoft Network Monitor 3.4, which is a tool for capturing network traffic.
To get started, download and run NM34_x64.exe. When you install Network Monitor, it installs its driver and hooks it to all the network adapters installed on the device. You can see the same on the adapter properties, as shown in the following image.
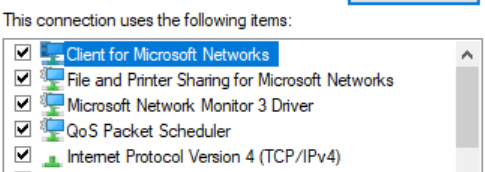
When the driver gets hooked to the network interface card (NIC) during installation, the NIC is reinitialized, which might cause a brief network glitch.
To capture traffic
-
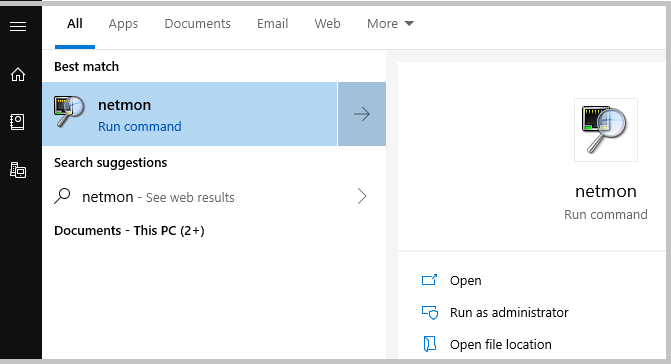
Click Start and enter Netmon.
-
For netmon run command,select Run as administrator.
-
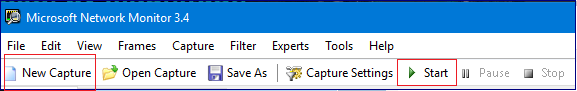
Network Monitor opens with all network adapters displayed. Select New Capture, and then select Start.
-
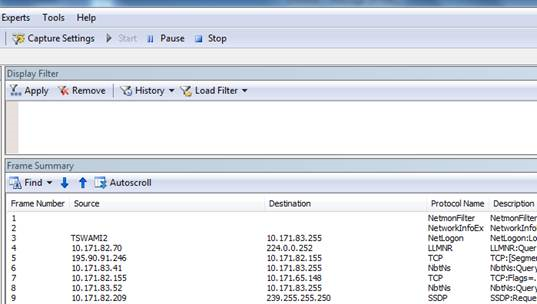
Reproduce the issue, and you will see that Network Monitor grabs the packets on the wire.
-
Select Stop, and go to File > Save as to save the results. By default, the file will be saved as a ".cap" file.
The saved file has captured all the traffic that is flowing to and from the network adapters of this machine. However, your interest is only to look into the traffic/packets that are related to the specific connectivity problem you are facing. So you will need to filter the network capture to see only the related traffic.
Commonly used filters
- Ipv4.address=="client ip" and ipv4.address=="server ip"
- Tcp.port==
- Udp.port==
- Icmp
- Arp
- Property.tcpretranmits
- Property.tcprequestfastretransmits
- Tcp.flags.syn==1
Tip
If you want to filter the capture for a specific field and do not know the syntax for that filter, just right-click that field and select Add the selected value to Display Filter.
Network traces which are collected using the netsh commands built in to Windows are of the extension "ETL". However, these ETL files can be opened using Network Monitor for further analysis.