6.7 KiB
title, ms.reviewer, description, keywords, search.product, search.appverid, ms.prod, ms.mktglfcycl, ms.sitesec, ms.pagetype, ms.author, author, ms.localizationpriority, manager, audience, ms.collection, ms.topic
| title | ms.reviewer | description | keywords | search.product | search.appverid | ms.prod | ms.mktglfcycl | ms.sitesec | ms.pagetype | ms.author | author | ms.localizationpriority | manager | audience | ms.collection | ms.topic |
|---|---|---|---|---|---|---|---|---|---|---|---|---|---|---|---|---|
| Create and manage custom detection rules in Microsoft Defender ATP | Learn how to create and manage custom detections rules based on advanced hunting queries | custom detections, create, manage, alerts, edit, run on demand, frequency, interval, detection rules, advanced hunting, hunt, query, response actions, mdatp, microsoft defender atp | eADQiWindows 10XVcnh | met150 | w10 | deploy | library | security | lomayor | lomayor | medium | dansimp | ITPro | M365-security-compliance | article |
Create and manage custom detections rules
Applies to:
Custom detection rules built from Advanced hunting queries let you proactively monitor various events and system states, including suspected breach activity and misconfigured machines. The queries run every 24 hours, generating alerts and taking response actions whenever there are matches.
Note
To create and manage custom detections, your role needs to have the manage security settings permission.
Create a custom detection rule
1. Prepare the query.
In Microsoft Defender Security Center, go to Advanced hunting and select an existing query or create a new query. When using an new query, run the query to identify errors and understand possible results.
Required columns in the query results
To use a query for a custom detection rule, the query must return the EventTime, MachineId, and ReportId columns in the results. Simple queries, such as those that don’t use the project or summarize operator to customize or aggregate results, typically return these common columns.
There are various ways to ensure more complex queries return these columns. For example, if you prefer to aggregate and count by MachineId, you can still return EventTime and ReportId by getting them from the most recent event involving each machine.
The sample query below counts the number of unique machines (MachineId) with antivirus detections and uses this count to find only the machines with more than five detections. To return the latest EventTime and the corresponding ReportId, it uses the summarize operator with the arg_max function.
MiscEvents
| where EventTime > ago(7d)
| where ActionType == "AntivirusDetection"
| summarize (EventTime, ReportId)=arg_max(EventTime, ReportId), count() by MachineId
| where count_ > 5
2. Create new rule and provide alert details.
With the query in the query editor, select Create detection rule and specify the following alert details:
- Alert title
- Severity
- Category
- Description
- Recommended actions
For more information about these alert details, read about managing alerts.
3. Specify actions on files or machines.
Your custom detection rule can automatically take actions on files or machines that are returned by the query.
Actions on machines
These actions are applied to machines in the MachineId column of the query results:
- Isolate machine — applies full network isolation, preventing the machine from connecting to any application or service, except for the Microsoft Defender ATP service. Learn more about machine isolation
- Collect investigation package — collects machine information in a ZIP file. Learn more about the investigation package
- Run antivirus scan — performs a full Windows Defender Antivirus scan on the machine
- Initiate investigation — initiates an automated investigation on the machine
Actions on files
These actions are applied to files in the SHA1 or the InitiatingProcessSHA1 column of the query results:
- Allow/Block — automatically adds the file to your custom indicator list so that it is always allowed to run or blocked from running. You can set the scope of this action so that it is taken only on selected machine groups. This scope is independent of the scope of the rule.
- Quarantine file — deletes the file from its current location and places a copy in quarantine
4. Click Create to save and turn on the rule.
When saved, the custom detection rule immediately runs. It runs again every 24 hours to check for matches, generate alerts, and take response actions.
Manage existing custom detection rules
In Settings > Custom detections, you can view the list of existing custom detection rules, check their previous runs, and review the alerts they have triggered. You can also run a rule on demand and modify it.
View existing rules
To view all existing custom detection rules, navigate to Settings > Custom detections. The page lists all the rules with the following run information:
- Last run — when a rule was last run to check for query matches and generate alerts
- Last run status — whether a rule ran successfully
- Next run — the next scheduled run
- Status — whether a rule has been turned on or off
View rule details, modify rule, and run rule
To view comprehensive information about a custom detection rule, select the name of rule from the list of rules in Settings > Custom detections. This opens a page about the custom detection rule with the following information:
- General information about the rule, including the details of the alert, run status, and scope
- List of triggered alerts
- List of triggered actions
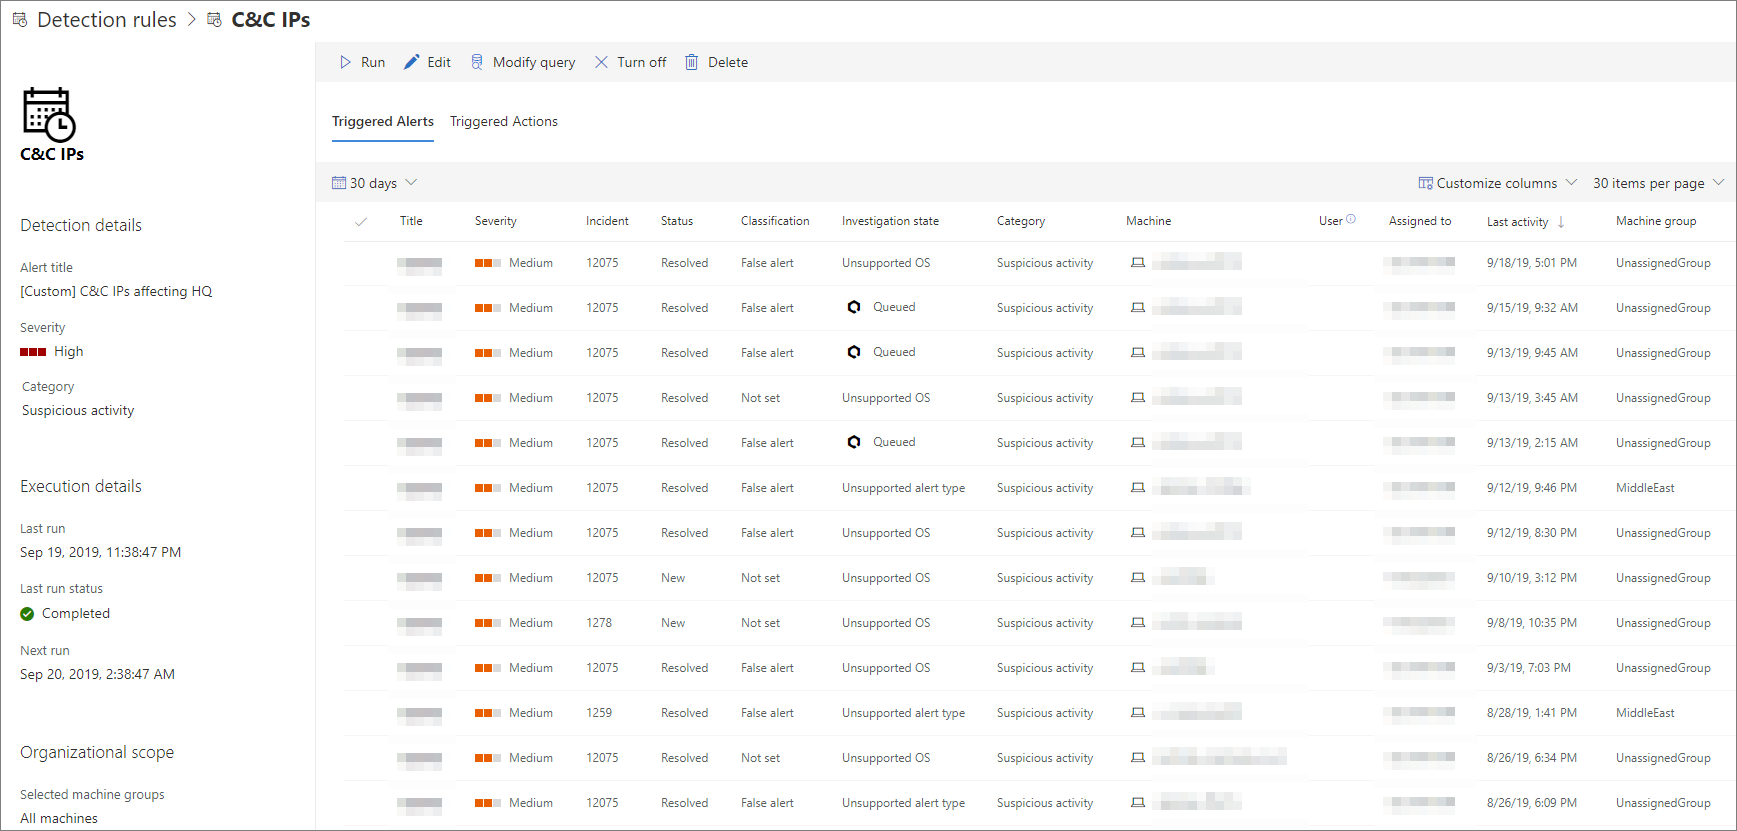
Custom detection rule page
You can also take the following actions on the rule from this page:
- Run — run the rule immediately. This also resets the interval for the next run.
- Edit — modify the rule without changing the query
- Modify query — edit the query in Advanced hunting
- Turn on / Turn off — enable the rule or stop it from running
- Delete — turn off the rule and remove it
Tip
To quickly view information and take action on an item in a table, use the selection column [✓] at the left of the table.